Timeline
Compare project Git histories and first appearances of mapped files across the workspace.
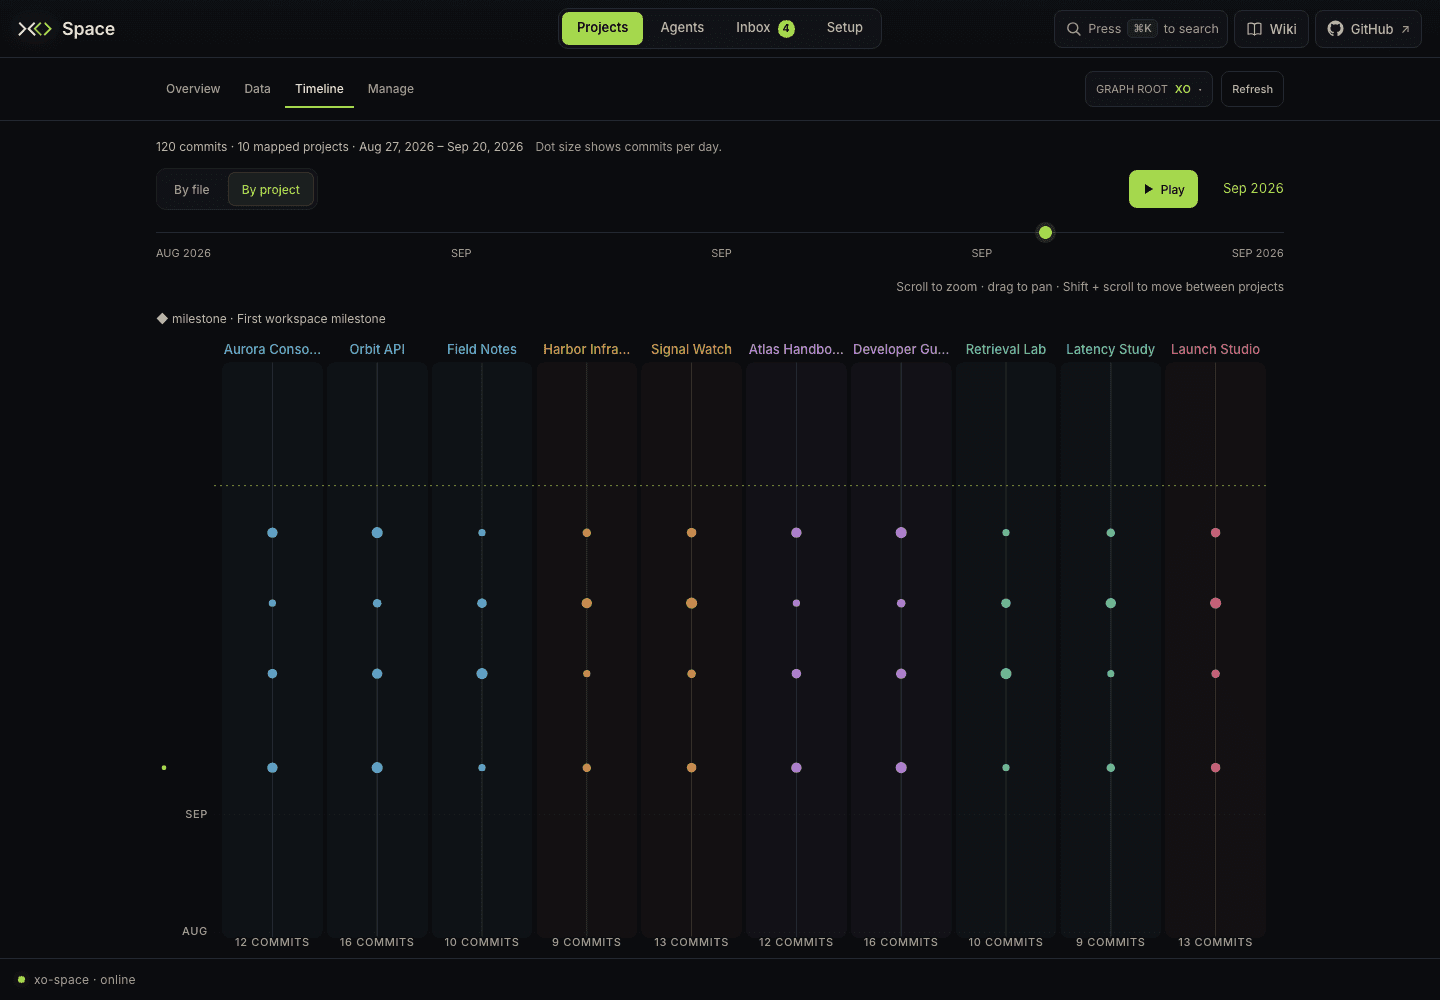
Timeline shows when work entered Git history. It places projects in parallel lanes with time flowing upward: newest at the top, oldest at the bottom.
Open Projects → Timeline, or use /space/#/projects/timeline. Timeline is part of Projects; the older #/time and #/timeline links also resolve here.
Choose what to plot
| Mode | What a dot means | Useful for |
|---|---|---|
| By file | A mapped file's first-appearance commit date. | Seeing when artifacts entered a project and tracing related files from Graph. |
| By project | A day with commits in that project's Git history; larger dots represent more commits that day. | Comparing activity across repositories, including changes to existing files. |
The mode switch appears when the workspace dataset contains Git history. Space remembers your chosen mode in the browser. Each mode fits the dates it actually plots, so their axes can cover different periods.
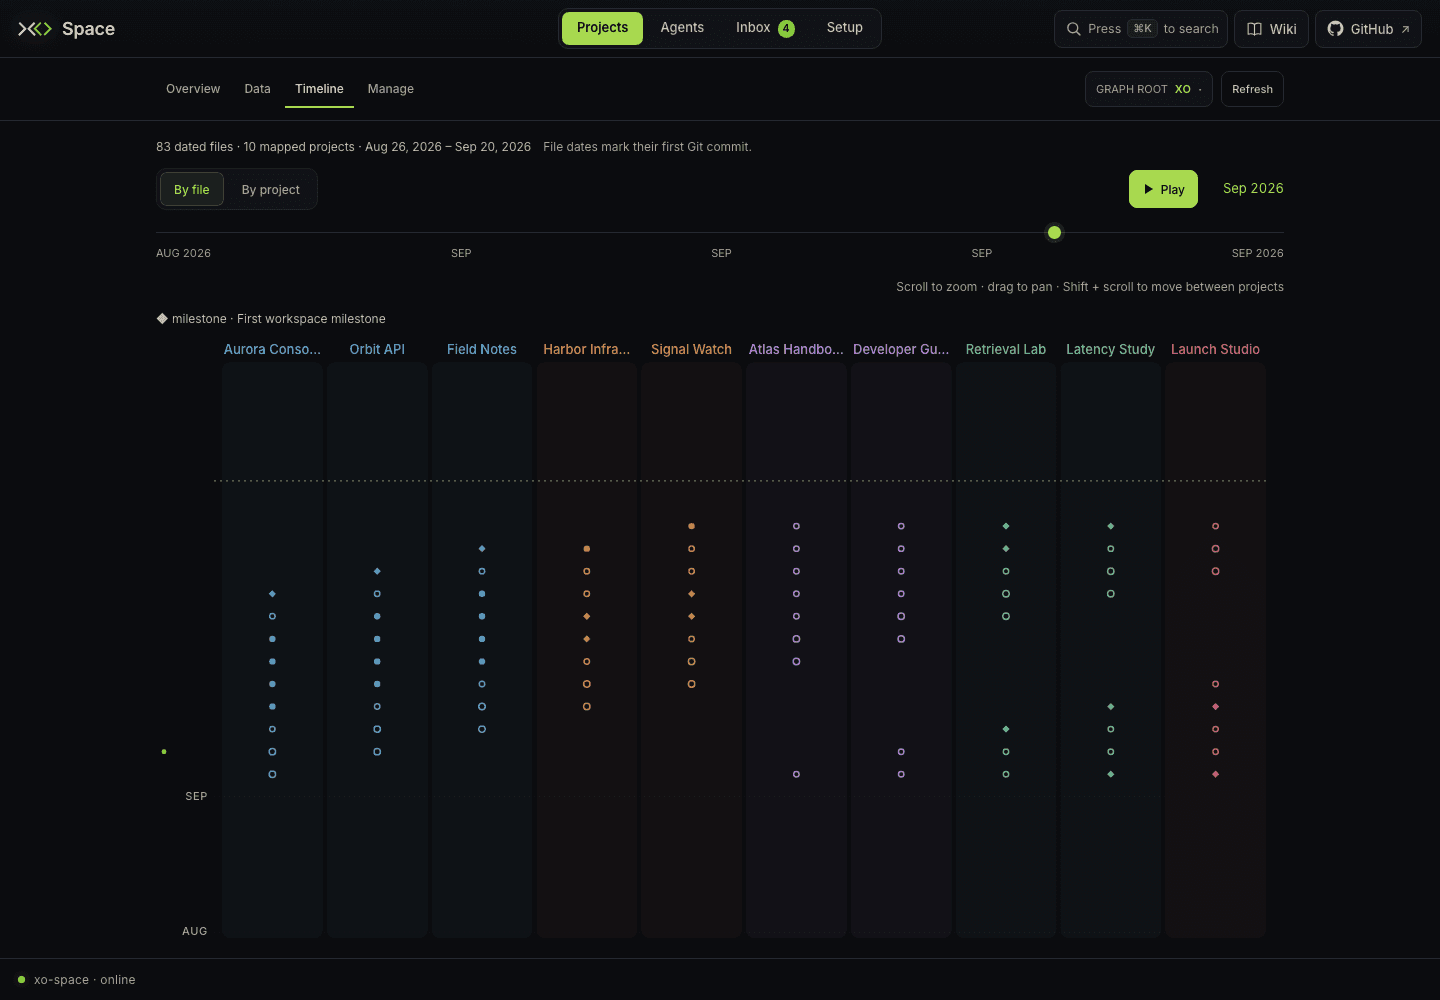
The summary reports the plotted dates and counts for the selected mode and filtered lanes. Every project keeps a lane. A project without dates to plot has a dark lane, and the description reports how many projects lack Git history. In By file, uncommitted or otherwise undated files have no dots.
A first-appearance date is a Git fact, not a file's filesystem creation or modification time. Timeline reads the workspace graph and Git history; Inbox → Activity is the separate view of normalized watcher activity.
Filter and navigate
- Filter projects… narrows lanes by project name.
- Wheel zooms the time axis around the pointer. Drag pans through time and across lanes.
- Shift + wheel moves horizontally across lanes when they exceed the available width.
- Year chips jump to a year. All restores the full date range.
- Hover a dot for its details. A By project dot shows the project's commit count and available commit subjects for that day.
- Click a file dot to open Graph focused on that file. Click a commit-day dot to focus its project on Graph; it does not open a diff or select every touched file.
Scrub and play
Move the range slider to change the current date. Play advances the sweep through the visible time window; Pause stops it. Dragging the slider stops playback so you can inspect a particular point. Starting Play at the end begins again from the start of the current window.
This is playback of dated map entries. It does not replay an agent's chat messages or tool executions. For run-level information, open Agents → Sessions.
Follow a Graph trace
In Graph, select a file or cluster and choose Show on timeline. The trace switches Timeline to By file, highlights the relevant dated entries, and resets a narrowed time window so the trace can be seen. It can start playback automatically unless reduced motion is enabled.
Use Clear trace to return to the normal timeline. A selection with no Git-dated files produces an explanatory message rather than invented dates. Choosing By project also clears a file trace.
Coverage and loading
Timeline always uses the workspace dataset at GET /xo/space.json. Opening it after Overview rebuilds the atlas for the workspace dataset without reloading the page. An open project file preview remains visible. An empty axis can mean that the selected projects have no Git history, that the filter hides the relevant lanes, or that the map has not refreshed yet. Check the mode, clear the lane filter, and choose All before changing the workspace root in Setup.