Projects Overview
Survey projects by purpose, explore their connections, and inspect recorded todos.
Overview is the first section inside Projects and the default view when you open Space without a saved URL hash. Its dashboard map groups projects by purpose. Each project is a node, surrounded by the purpose environments it belongs to.
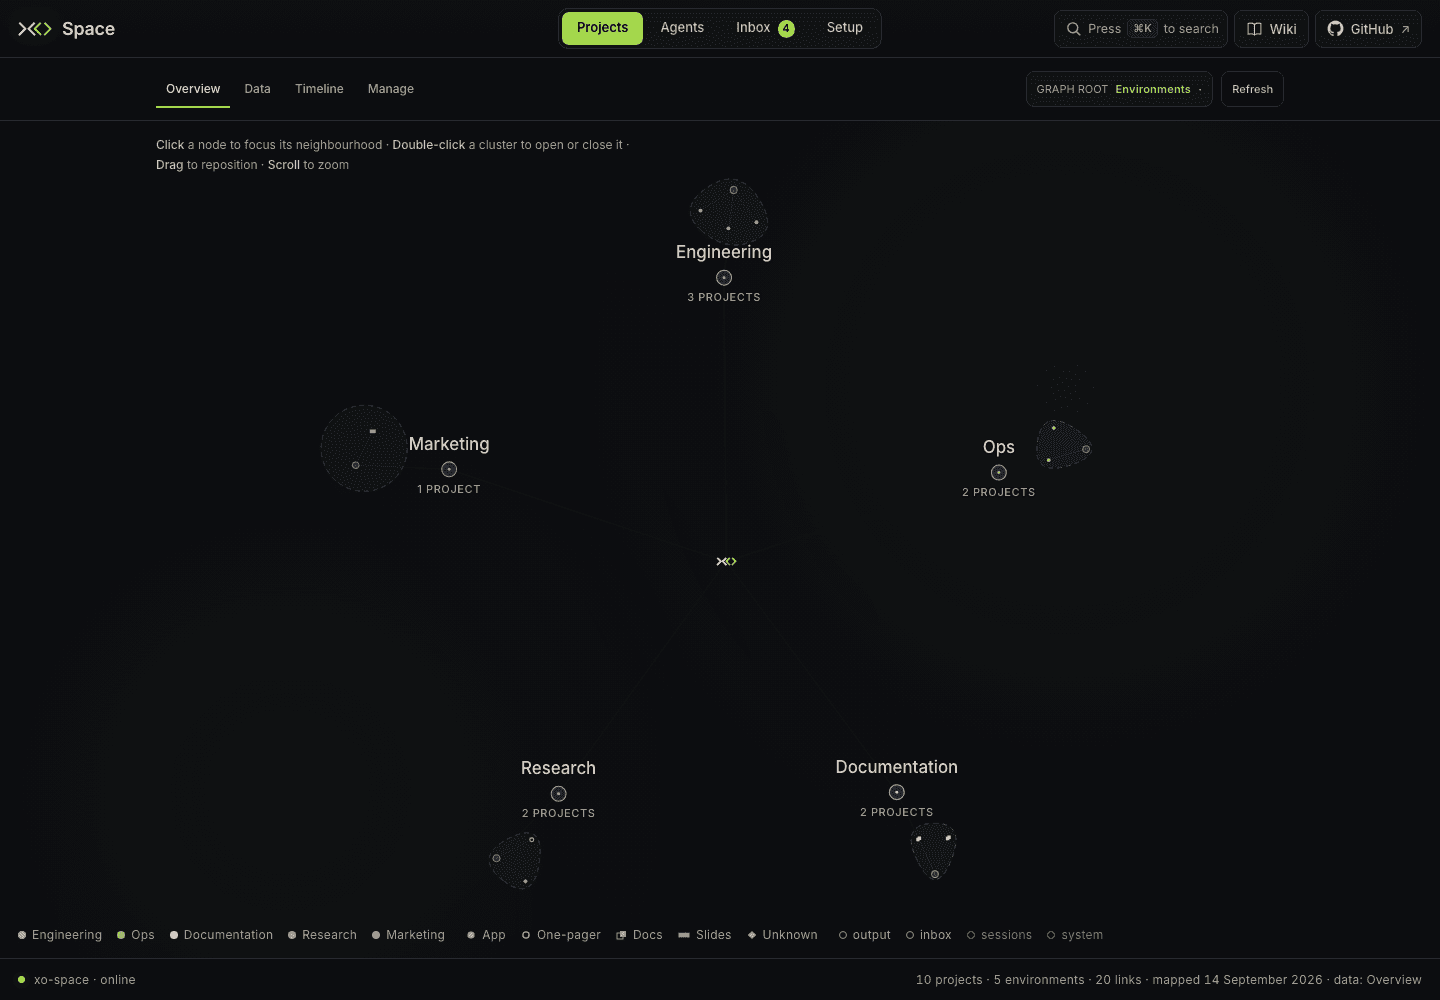
Open Projects → Overview, use /space/#/projects/overview, or click the primary Projects tab. The older #/dashboard link also opens Overview.
Read the map
The five environments describe what projects are for:
| Environment | Typical projects |
|---|---|
| Engineering | Apps, services, APIs, and libraries. |
| Ops | Infrastructure and operational tooling. |
| Documentation | Documentation sites, notes, wikis, and one-pagers. |
| Research | Papers, notebooks, studies, and exploratory work. |
| Marketing | Decks, brand assets, proposals, and launch material. |
A tinted, dashed boundary encloses each environment's projects. Projects can belong to several environments, so a single node may sit between overlapping boundaries. The environment's small anchor gives its label and layout a stable position. An empty environment can have a label without an enclosed area.
The node's shape describes its form separately: App, One-pager, Docs, Slides, or Unknown. The legend explains the current symbols. Saved project classification takes precedence over classification inferred from project paths and filenames.
Explore a project
- Click a project to focus its neighborhood and open the detail panel. The panel shows its description, related nodes, and recorded todos.
- Click a connection in the panel to move to that node.
- Double-click an environment or cluster to expand or collapse its projects. Drag a node to reposition it; drag empty canvas to pan; use the wheel to zoom.
- Use Graph root in the Projects navigation row to find a node by name or description and center the map around it. ⌘K / Ctrl+K opens global navigation and project search.
- Use Clear, the panel's close button, or Esc to clear focus. If a file preview is open, the first Esc closes that preview.
The Graph root picker can center the graph around a chosen node. Its Reset to … button restores the workspace root. This changes the view, not the workspace folder configured in Setup.
Inspect recorded work
Selecting a project fetches its todos. Up to 28 appear as satellites around the node and up to 40 appear in its detail panel. The status order is in progress, pending, blocked, completed, then cancelled. In-progress satellites have a spoke back to the project.
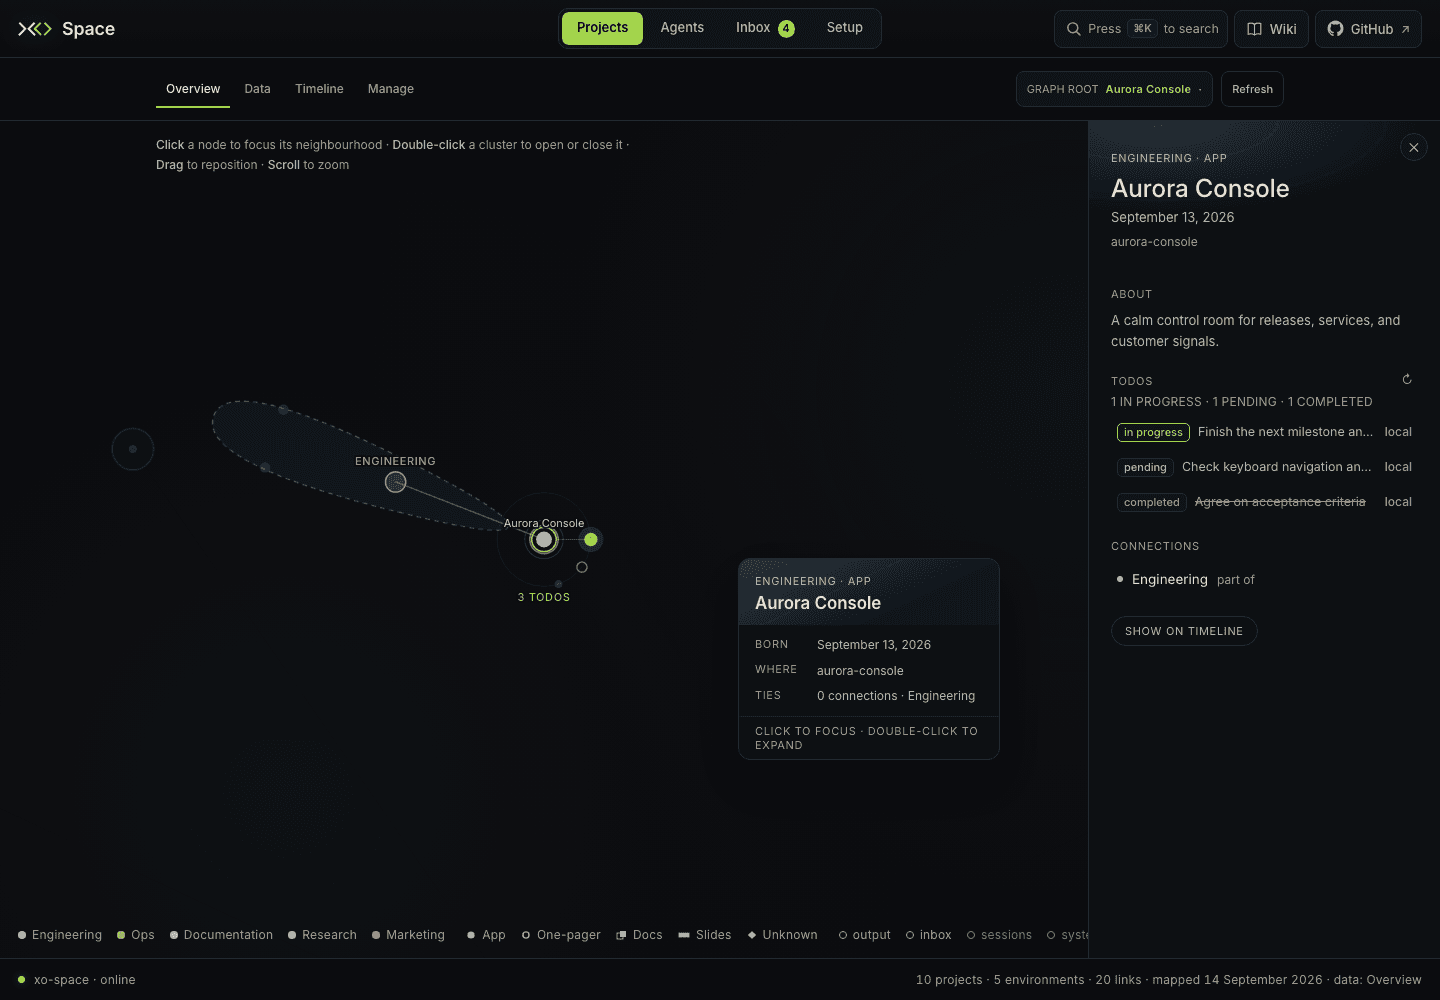
Click a satellite to locate its row in the panel, or click a todo row to highlight its satellite. Use the refresh control beside Todos to fetch the current list. Selecting a recently inspected project can reuse its todos for 20 seconds.
These are recorded project todos, not a list inferred from files or a guarantee that an agent is running now. Live presence appears in the Projects List. Dashboard reads todos; it does not create, edit, or complete them.
Change perspective
Choose Data → List for project folders, Data → Graph for mapped files and relationships, Data → Tree for hierarchy, or Timeline for Git history. Manage holds project actions and details; Sharing is under Inbox.
Overview and Graph use different datasets. Moving between them rebuilds the map without reloading the page, and an open file preview stays mounted. See Projects List and previews for its behavior.
Missing or old information
Dashboard reads the derived project map from GET /xo/dashboard.json. It does not rescan every project on each click. If a project is missing, confirm the Projects folder in Setup → Workspace, check that the folder is directly beneath it, and allow the workspace view to refresh. An empty workspace produces an empty map; creating a folder or project supplies the first node.