Agents & Telemetry
Compare local session usage, inspect prompts and trends, export metrics, and configure telemetry collection.
Agents brings local telemetry into four pages: Overview, Sessions, Trends, and Configure. Compare usage across runs, inspect one session, or manage the native sources Space reads.
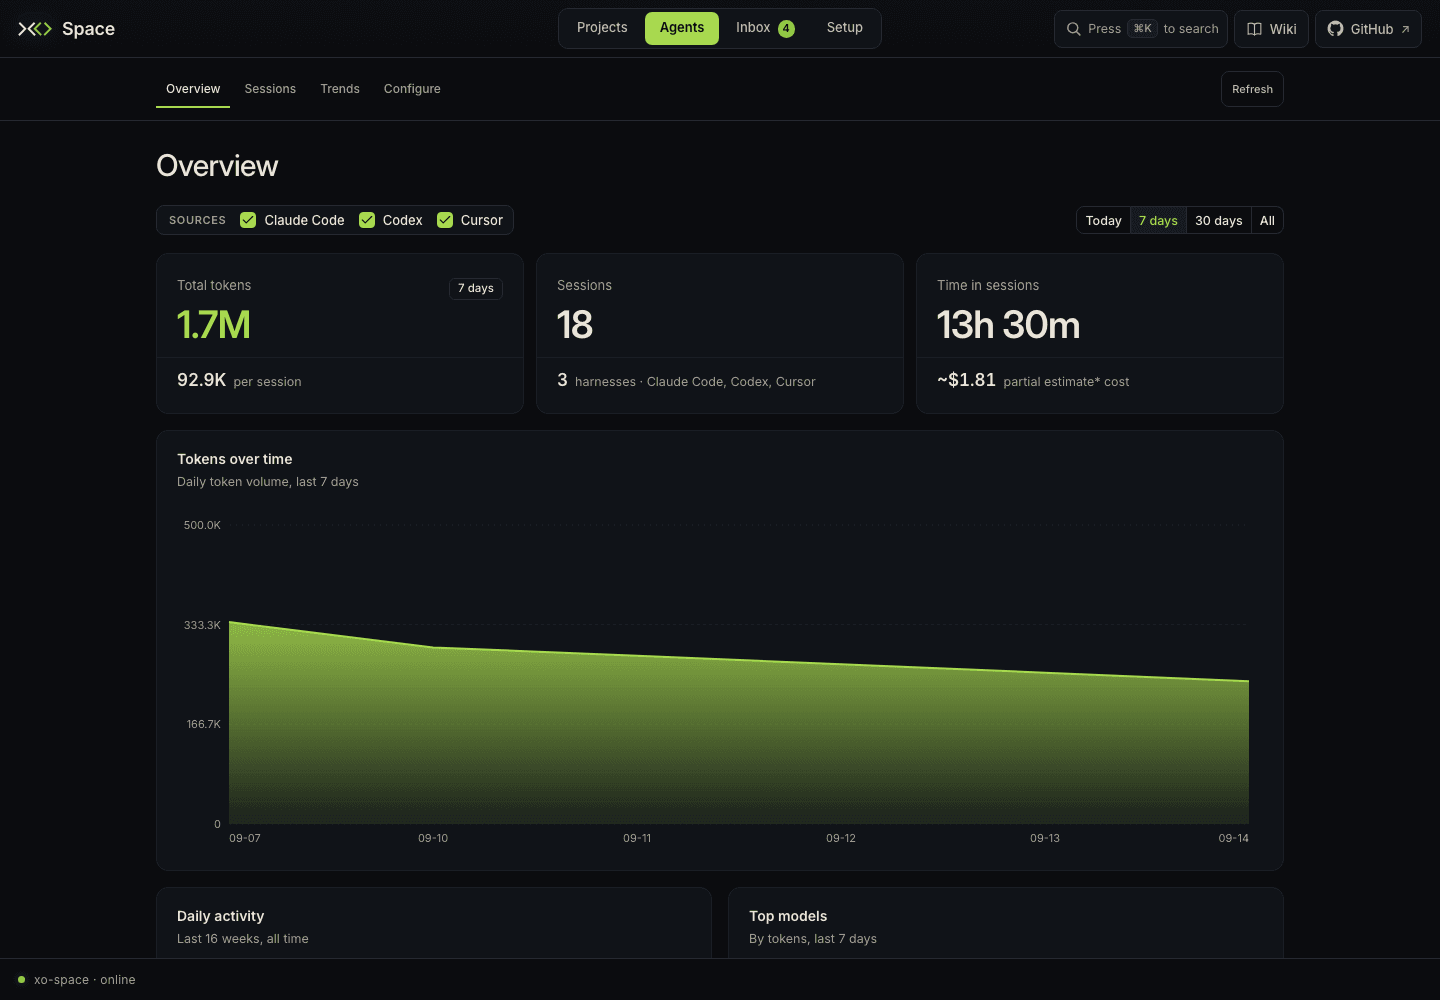
Open Agents, press 2, or use /space/#/agents/overview. The older #/sessions link opens Agents Overview. The documentation URL stays /docs/space/space-walk/sessions for existing bookmarks.
Select sources
Use the Sources checkboxes on Overview, Sessions, and Trends to include any combination of Claude Code, Codex, and Cursor. Available metrics depend on the native source. An unavailable source carries an offline label; hover it for the reported reason.
These checkboxes filter the displayed data. Collection switches in Configure control which sources Space reads. Selecting no sources produces No session sources selected. If every selected source is unavailable, restore access to its telemetry store or select another source.
Telemetry collection is distinct from watcher coverage and the active chat backend. A runtime can contribute watched project activity without providing aggregate session telemetry. Chat agents and the activity watcher are configured in Setup → Intelligence layer.
Know which filters apply
| Page | Scope and controls | Route |
|---|---|---|
| Overview | Source selection and Today, 7 days, 30 days, or All. Default: 7 days. The heatmap always covers the last 16 weeks. | #/agents/overview |
| Sessions | All loaded sessions for the selected sources, sortable columns, and 10 rows per page. No date-window control. | #/agents/sessions |
| Trends | Source selection and the same four date windows for model, project, tool, and MCP metrics; Export CSV controls. | #/agents/trends |
| Configure | Collection switches, source status, usage totals, and editable telemetry paths. | #/agents/configure |
Refresh fetches another snapshot. The server builds aggregate telemetry separately, so Refresh does not imply an immediate full rescan of every native log. The former Tools and Models pages are merged into Trends; #/agents/tools and #/agents/models remain aliases for it.
Start with Overview
Three headline cards show Total tokens and tokens per session, Sessions and the contributing harnesses, and Time in sessions with available estimated cost. The charts show Tokens over time, Daily activity, and Top models.
Top sessions ranks sessions by their token usage within the selected window. Click a row to inspect its full detail. The 16-week Daily activity heatmap keeps its longer context when you change the window.
Find an individual session
Choose Sessions. Click a column heading to sort by Started, Project, Source, Model, Tokens, Cost, Turns, or Duration; click again to reverse the order. Pagination moves through pages of 10 rows.
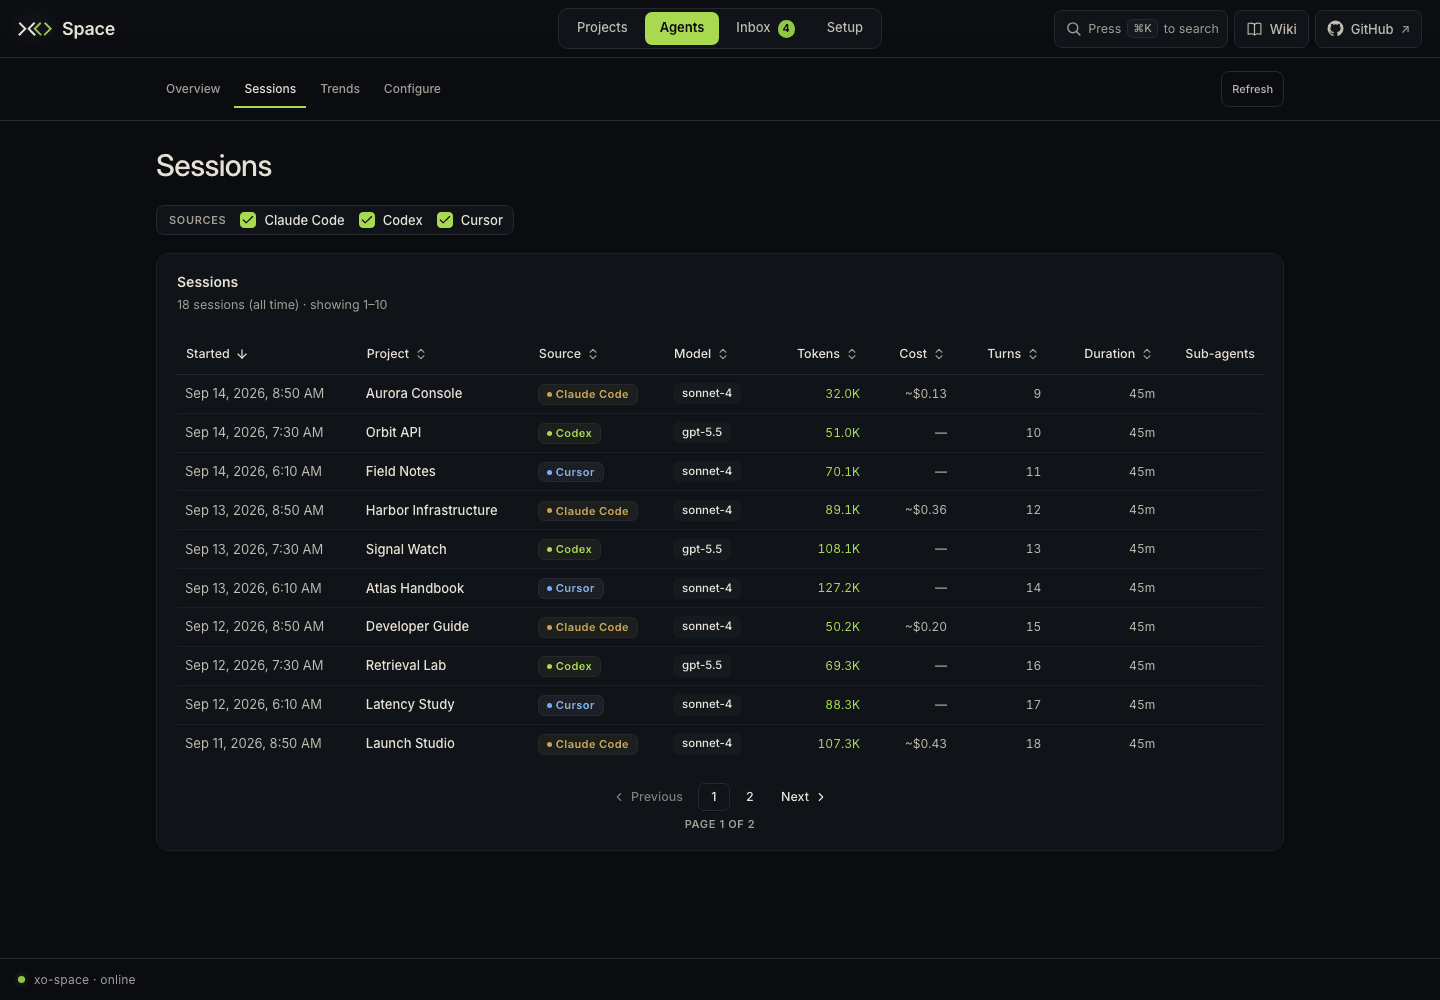
The caption distinguishes loaded rows from a larger total when only the newest sessions are available. Sorting, pagination, and an active Search loaded sessions… query operate on that loaded set. The query matches project, path, source, model, and session ID. It does not search prompt text or load older sessions. Each row includes its sub-agent count.
Read session details
A session opens within Agents → Sessions. Choose Sessions in its breadcrumb to return to the table.
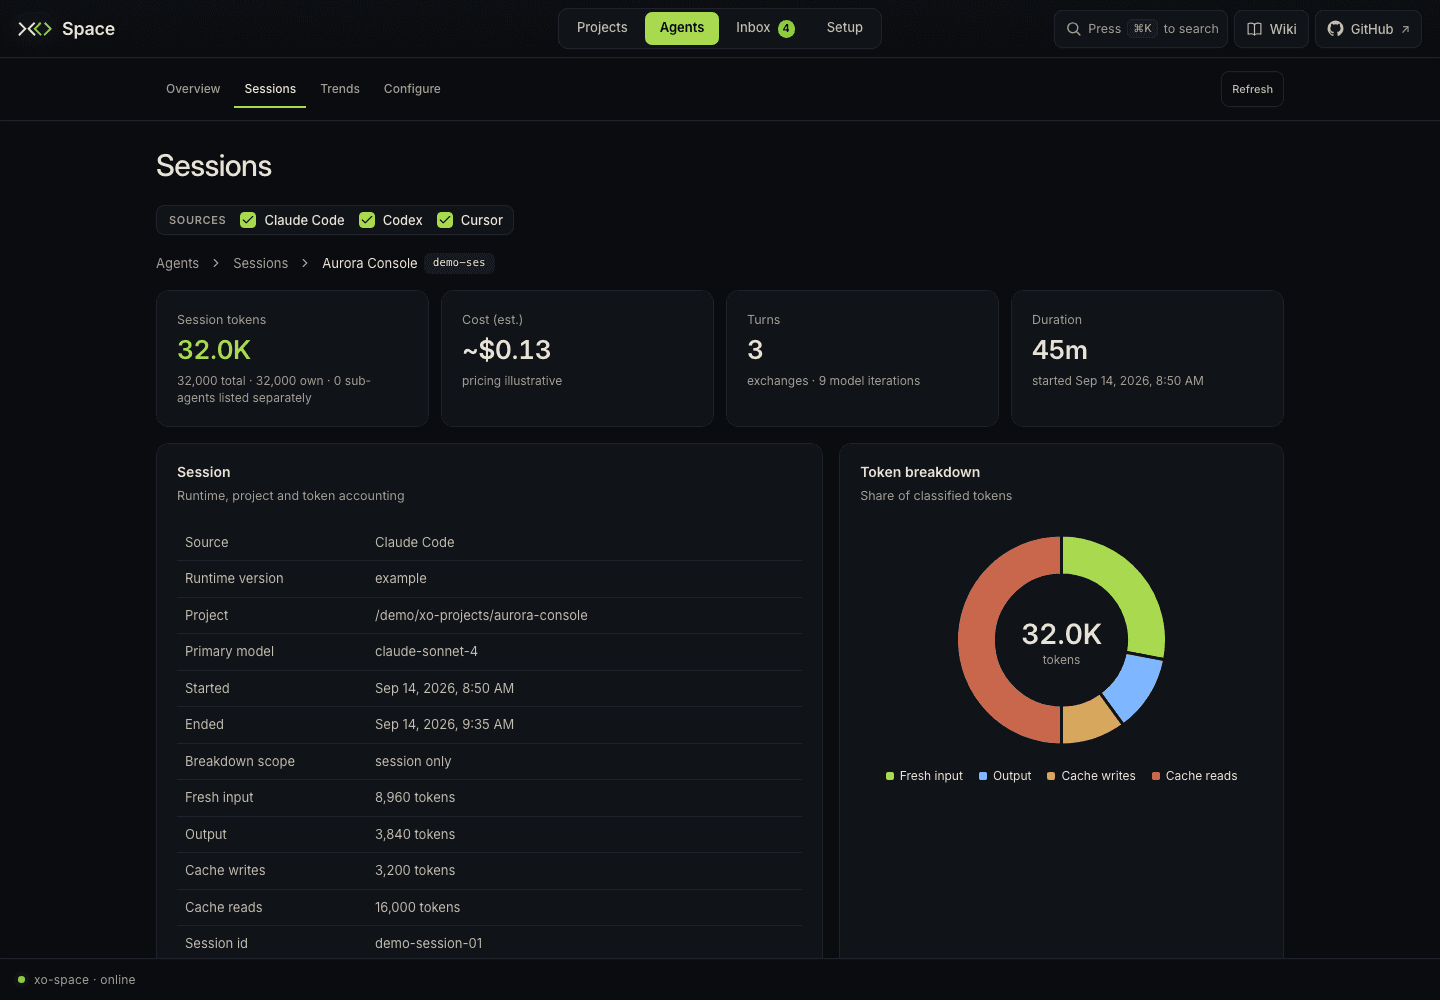
The detail contains:
- Session tokens: the total, its own-token portion, and the number of listed sub-agents. The Breakdown scope field says whether the figures include the session tree.
- Token categories: fresh input, output, cache writes, cache reads, and unclassified tokens when the source cannot fully categorize the total.
- Cost: a pricing estimate or an unavailable value, depending on the source.
- Turns and duration: the source's model-iteration count, start/end information, and elapsed duration.
- Session metadata: source, runtime version, project path, primary model, and session ID.
- Tools and sub-agents: tool calls/errors and each listed sub-agent's tokens, cost, and turns.
- Prompts by turn: typed user prompts fetched for this session on demand.
The authoritative session total can be larger than the categorized buckets. Unclassified preserves that difference; it does not imply zero usage. Read the scope before adding parent and sub-agent totals together.
Prompts by turn
The aggregate at GET /xo/sessions.json contains no prompt text. Opening a session requests its typed prompts separately through /space/data/session_prompts.json, and the browser caches that result for the page's lifetime.
Each turn shows the typed prompt, its time, and reply/tool-call counts when supplied by the source. It is not a full assistant transcript or a replay control. Capped results say that only the newest prompts are shown; shortened text is marked as truncated.
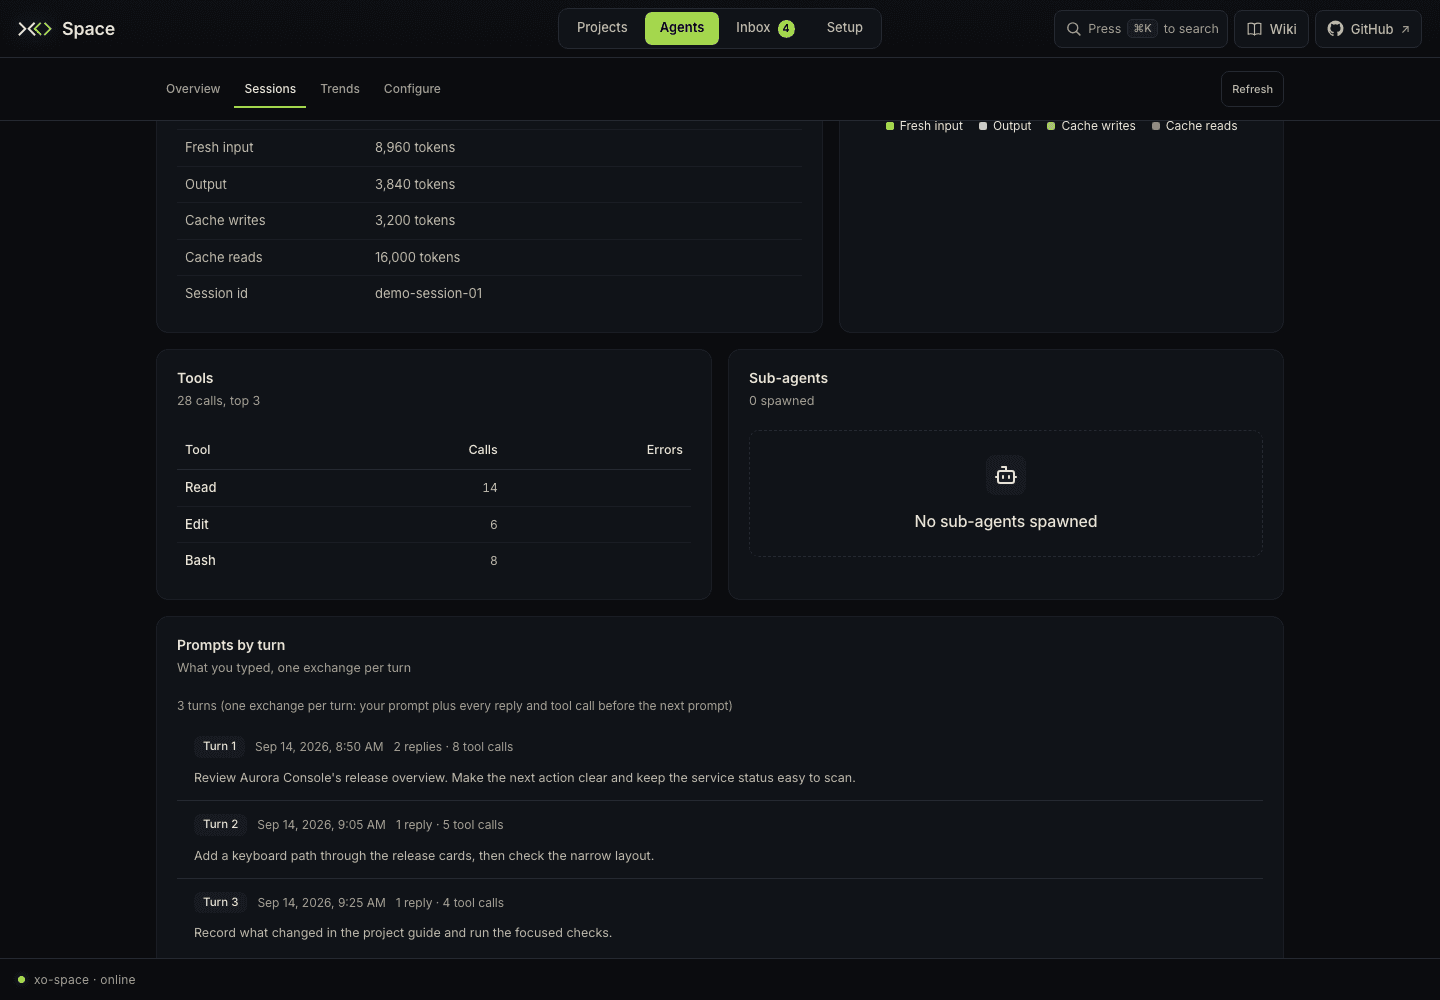
After supported prompt data arrives, the headline Turns can show human exchanges, with the model-iteration count beneath it. Missing or cleaned-up logs, unsupported prompt capture, and request failures have distinct messages.
Compare trends and export data
Trends combines the former Tools and Models views with project-level analysis. Select sources and a date window to inspect:
- Tokens per week by model and Tokens per week by project, stacked by the five heaviest groups.
- Models and Projects, showing their share of tokens.
- Tools, showing recorded calls, errors, and error rates.
- MCP servers, grouping calls routed through MCP tools.
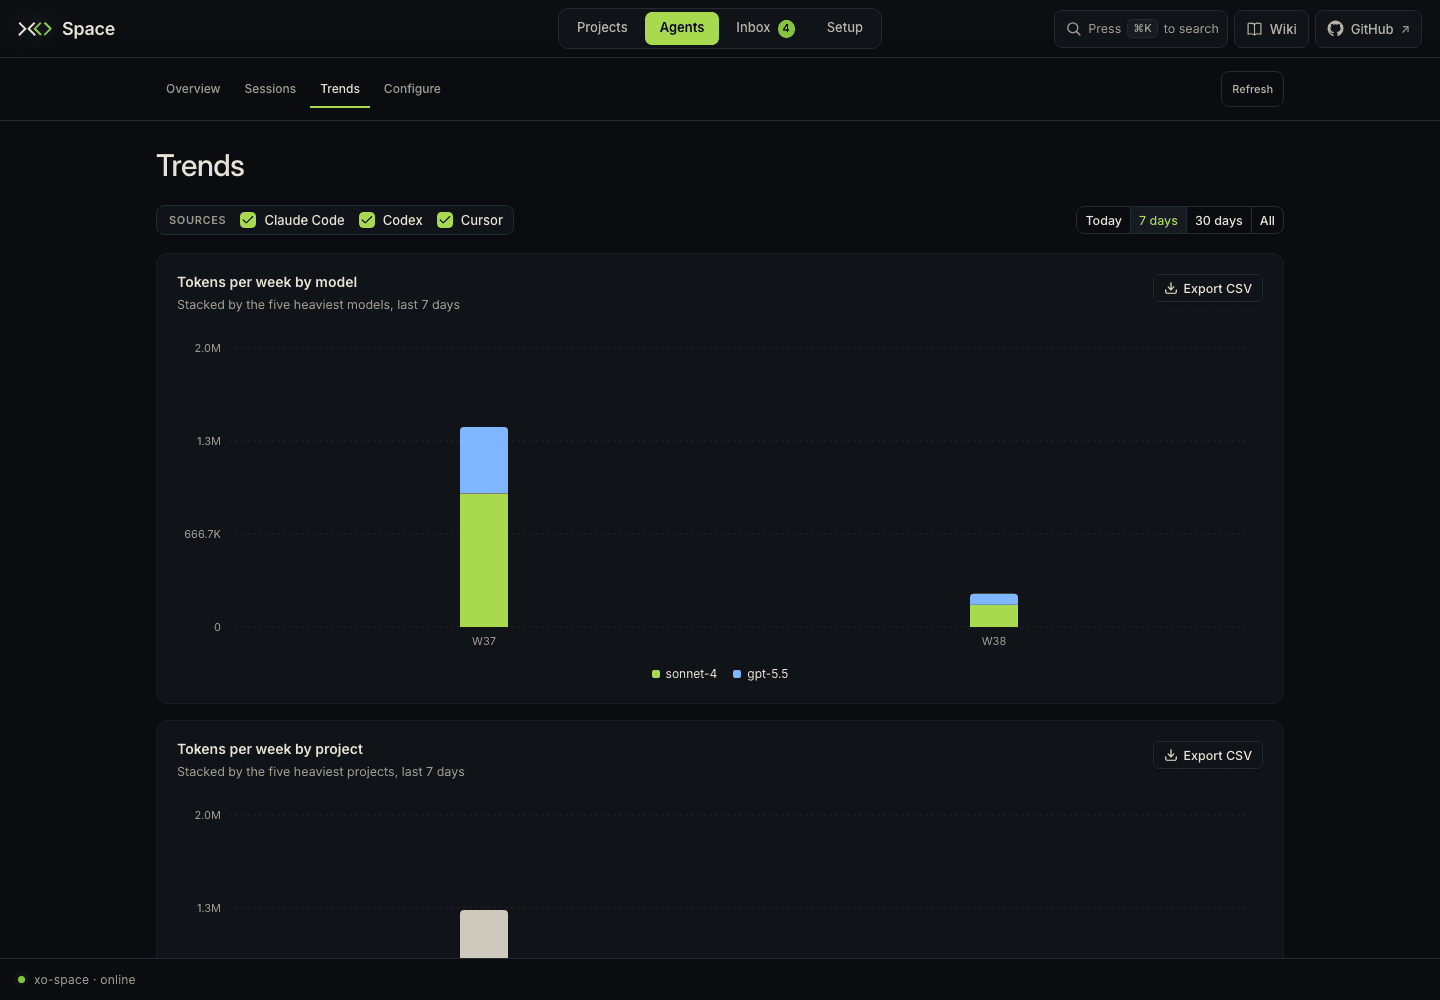
Use Export CSV on a card to download its data for the current source selection and window. Exports include cost availability; an unavailable cost remains blank. Project grouping joins telemetry to the loaded session catalog, so rows without loaded project metadata appear as Other sessions.
Configure telemetry collection
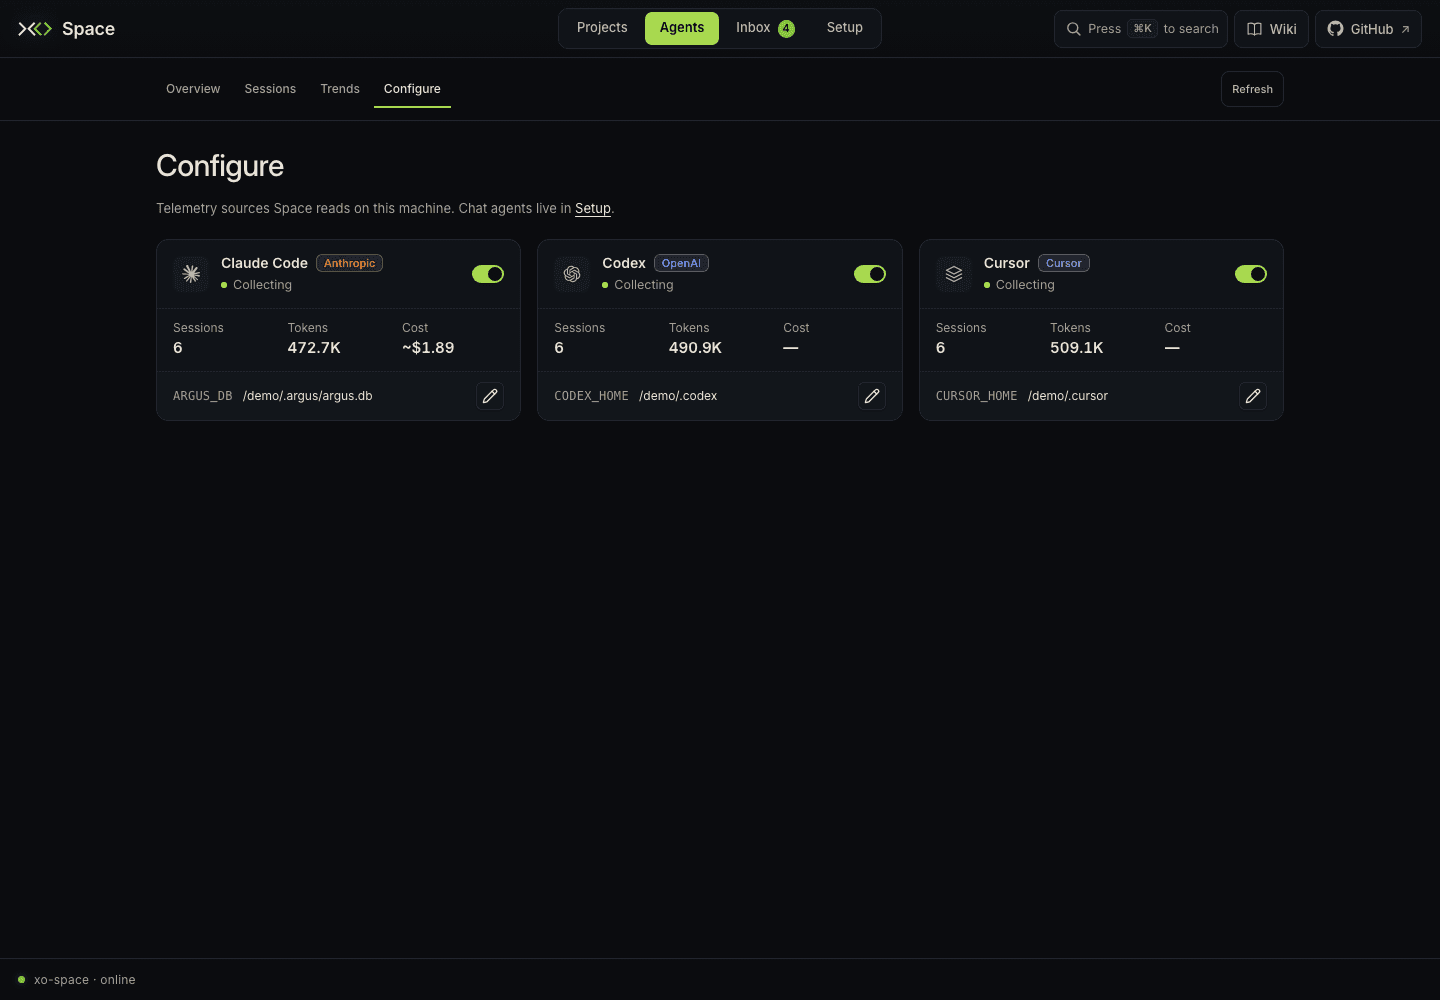
Open Agents → Configure. Each source card shows its vendor, collection status, recorded sessions/tokens/cost, a collection switch, and its native data path.
| Status | Meaning |
|---|---|
| Collecting | Collection is enabled and the source is readable. |
| Paused | Collection was disabled for this source. |
| Pending / Starting | The next aggregate build has not reported the new state yet. |
| Not found | Collection is enabled but the source is unavailable; the card gives the reason. |
Use the card's switch to pause or enable collection. To change an editable path, choose its pencil Edit control, enter the path, and Save. Use default removes a custom path; Cancel discards the edit. Changes trigger a later telemetry refresh without selecting a different chat agent.
The native path settings include ARGUS_DB for Claude Code, CODEX_HOME for Codex, and CURSOR_HOME for Cursor. Point them to telemetry stores on the machine running Space. Sources marked Discovered automatically do not expose a path editor.
Codex sessions
Enable Codex collection and ensure CODEX_HOME points to the Codex home directory. Space reads the local session metadata and rollout logs for token totals, duration, models, tool activity, and typed prompts where available. An incomplete token breakdown is preserved as Unclassified; Codex cost is shown as unavailable when the source does not report it.
Read cost honestly
~$ indicates an estimate. Unavailable or a dash means the source did not report cost. A starred partial estimate includes only selected sources with known cost; it is not the total bill for the combined selection.
Source availability, missing costs, and partial token categories are reported explicitly. An empty or unavailable metric is not evidence that no work happened. Check the selected sources and their native paths in Agents → Configure before interpreting it as zero.
For the distinction between telemetry, Timeline playback, and the separate Space Walk tool, see Session replay.