Reading the Data
Find live project activity, compare session telemetry, and understand the limits of tokens, costs, todos, and git history.
Space reads supported runtime stores and project files to show what happened, where it happened, and what usage was recorded. Use the different views together to distinguish active work, completed steps, delivered files, and cost.
Choose the right view
| Question | Where to look |
|---|---|
| Which project has recent agent activity? | Projects → List, then its live badge and activity columns. |
| What steps are open or blocked? | A project's Todos panel, or its selected node on Dashboard. |
| When did files and commits enter Git history? | Timeline; use file previews to inspect current or historical contents. |
| How much usage was recorded, and which tools were called? | Sessions and its Overview, Sessions, Tools, Models, and Trends views. |
| What needs attention? | Inbox, filtered to the relevant source. |
| Why is telemetry missing? | Sessions → Sources and the server log for aggregate usage; Setup → Native session sources and watcher status for native activity coverage. |
Follow an active project
Run your agent inside a project under the XO projects root. The watcher polls supported native session stores, attributes events to projects, and updates machine-local presence and history. It does not require you to start every task through Space.
In Projects → List, refresh and open the project row. The live badge, open sessions, and events describe activity the watcher could observe. A missing badge can mean no recent observable activity, an unreadable source, or a session that could not be mapped to this project; it does not prove that every agent process has stopped.
Watcher coverage is selected separately from the active chat backend. The local
installer defaults to all; active limits watcher ingestion to the selected
runtime. The current Sessions dashboard discovers its own telemetry providers
independently of that watcher switch.
Read Sessions accurately
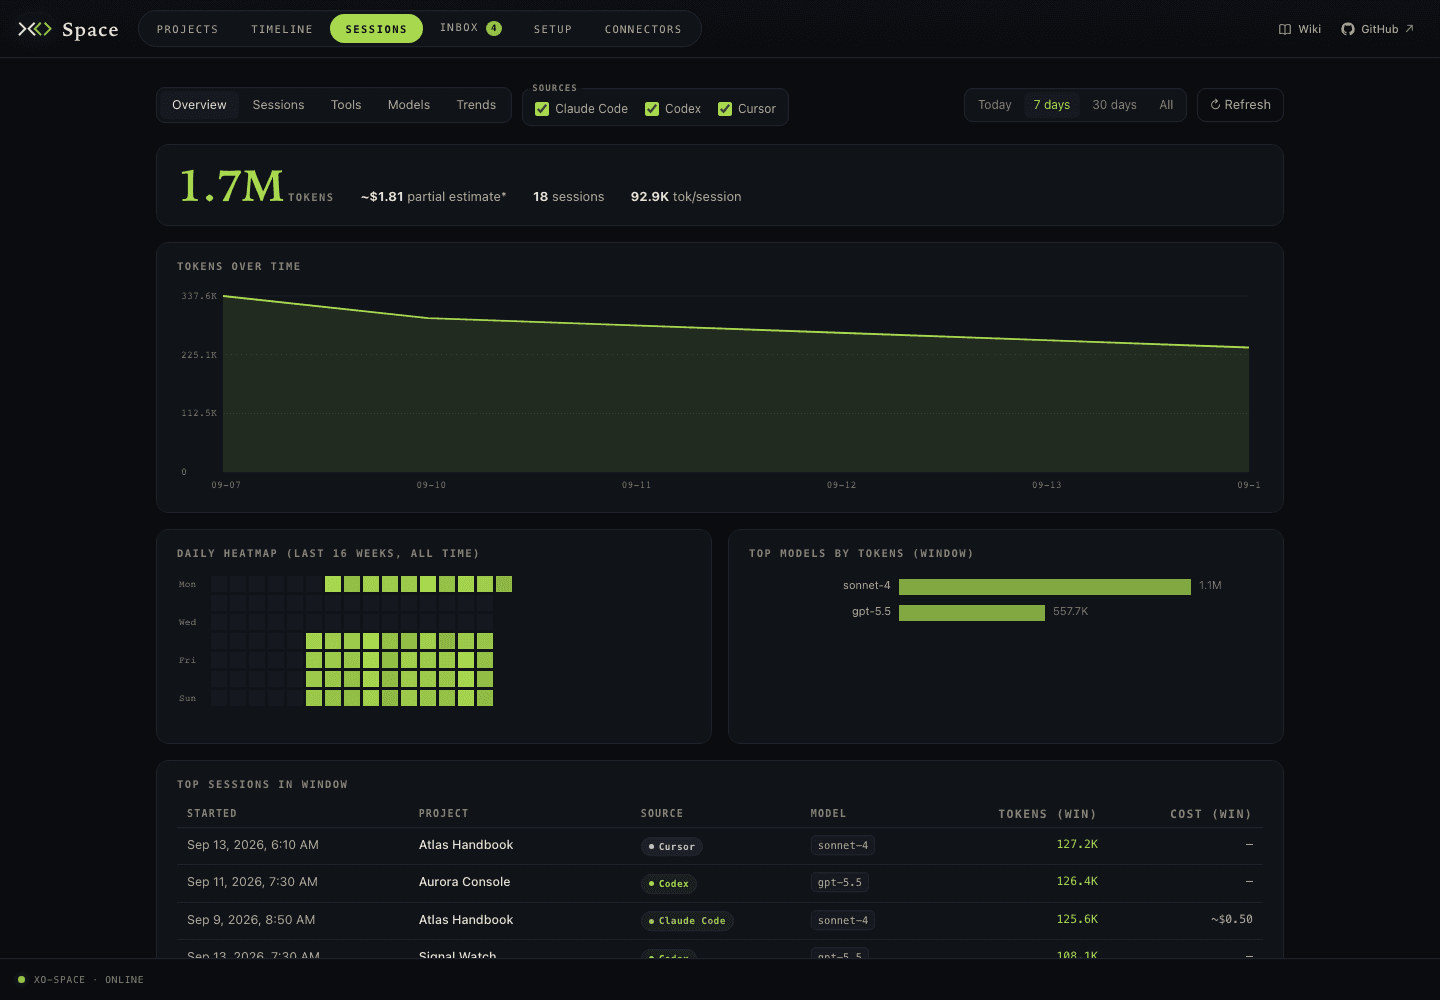
The current aggregate Sessions dashboard has providers for Claude Code, Codex, and Cursor. Other chat-capable runtimes can contribute native sessions and watcher events without having a provider for this aggregate view.
- Use Sources to choose which runtimes contribute. This selection applies across all five subviews.
- In Overview or Tools, choose Today, 7 days, 30 days, or All. The Overview heatmap always shows the last 16 weeks, independently of that window.
- Open the Sessions subview to sort and page through all loaded sessions for the selected sources. Select a row for model, tool, sub-agent, and typed-prompt details.
- Use Models for an all-time model breakdown and Trends for an all-time weekly breakdown. These views have no date-window control. Refresh retrieves a newer aggregate payload; it does not clear the page's cached prompt details.
Session identity includes its runtime, so similarly named sessions from different sources remain distinct. Parent/subagent information is only as complete as the source's recorded relationships.
Tokens and costs
| Display | Meaning |
|---|---|
| Claude Code cost | An estimate based on the Argus telemetry/pricing data. |
| Codex or Cursor cost shown as unavailable | That provider does not report cost to this dashboard; it is not a zero-cost run. |
| Partial cost estimate | The total includes only sources with known estimates; other usage is excluded from the cost sum. |
| Unclassified tokens or unknown breakdown | Some or all tokens could not be assigned to fresh input, output, cache reads, or cache writes. Cursor can use an explicitly marked text-length estimate when native counters are absent. |
| No data in a time window | No rows match the selected time/source filters in the loaded payload. |
These are observability metrics, not a provider invoice or an automatic quality score. A large token count does not show that an outcome was useful or accepted.
Prompt details
The aggregate /xo/sessions.json payload does not contain prompt text. Opening
session details can fetch user prompts separately from the provider's native
transcript, grouped into human turns with reply/tool-call counts when available.
The detail view shows typed prompts, not full assistant replies. Sources without
that capability show it as unsupported; missing logs have a separate message.
Connect activity to an outcome
Todos, git history, and file previews answer different questions:
- Todos record work through
/api/xo-projects/{id}/todos. A native runtime todo tool alone does not populate Space's shared list. - Files let you inspect the resulting document or source change.
- Git history records committed versions. Timeline file dates come from git, rather than file modification time or the moment a session started.
- Timeline playback advances through dated map entries. The separate Space Walk application described in the replay guide has its own session replay and optional evaluation features; the current Space Sessions view does not launch it. See Session replay.
Review the actual output and relevant validation before treating a task as complete. The quirq concept describes verified, owner-valued work; ordinary session telemetry does not automatically certify it.
Refresh and missing data
Space materializes workspace views on disk. The watcher refreshes those views at
most every XO_VIEWS_REFRESH_S (default 30 seconds). A request can rebuild a
missing or stale view; XO_VIEW_MAX_AGE_S defaults to 120 seconds. The UI's Refresh
button can therefore retrieve a cached aggregate rather than force an immediate
rescan of every store.
If a rebuild fails, a valid older payload can still be served. If there is no usable payload, the view reports its error. Use the displayed generation time, source status, and Setup to distinguish stale data from an empty workspace.
Useful read-only checks are:
curl -fsS http://localhost:5002/health
curl -fsS http://localhost:5002/api/runtime-config
curl -fsS http://localhost:5002/xo/sessions.json
curl -fsS http://localhost:5002/api/xo-projects/activity
The API explorer at your running server's /docs describes that build's routes.
See runtime discovery for source-specific checks.
Follow the data back to its source
Read the storage hierarchy and catalog to locate a record, or collection and reporting to understand how it was produced, what can leave the machine, and how long it is kept.